
The Indian Canvas #151: Who Pays to Breathe?
On Wednesday 21 October 2026, Delhi's daily average air quality index reached 245 on the Central Pollution Control Board's bulletin, "poor" on the national scale, and the Commission for Air Quality Management invoked Stage I of the Graded Response Action Plan across the National Capital Region the same evening. It was the season's first "poor" day, reported as the highest reading in 100 days.
The recurrence is the story. An analysis by the Centre for Research on Energy and Clean Air, reported on 22 October 2026, compared the endpoints of four winters under the revised emergency system: Delhi's average winter AQI was 280 in 2022-23 and 295 in 2025-26. Year-to-year weather and emissions confound any two-endpoint comparison. The later endpoint is higher; those figures alone cannot establish what the emergency measures changed.
What the air costs
One assessment of what this costs comes from the Global Burden of Disease collaboration. Its India study, published in The Lancet Planetary Health in December 2020, attributed 1.67 million deaths in 2019 to air pollution, with a 95 percent uncertainty interval of 1.42 to 1.92 million, or 17.8 percent of all deaths in the country that year. These are modelled estimates, not counted bodies, and the paper reports them with their uncertainty bands. Two modelled trends inside the same study point in opposite directions: the death rate attributed to household air pollution, the smoke of cooking fires, fell 64 percent between 1990 and 2019, while the rate attributed to ambient outdoor particulate pollution rose 115 percent. The study put the economic loss at US$36.8 billion in 2019, 1.36 percent of GDP, and noted that the losses as a share of state GDP were highest in the low per-capita GDP states: Uttar Pradesh, Bihar, Rajasthan, Madhya Pradesh and Chhattisgarh.
The University of Chicago's Air Quality Life Index keeps a more current, and explicitly modelled, ledger. Its 2025 update, built from satellite-derived measurements of 2023, estimates India's annual average PM2.5 at 41 micrograms per cubic metre, more than eight times the World Health Organization's guideline of 5 and a shade above India's own national standard of 40. In the index's model, all of India's 1.4 billion people lived in areas where 2023 exposure exceeded the WHO guideline, and 46 percent lived above India's own standard. The index then runs a counterfactual: if that pollution were permanently brought down to the guideline, the average Indian would gain 3.5 years of life expectancy. These are modelled potential gains, not measured individual losses. For Delhi, where modelled 2023 exposure averaged 88.4 micrograms per cubic metre, the potential gain is 8.2 years, which the index calls the highest across all regions it tracks globally. For the 544 million people of the Northern Plains, it is five years.
Modelled years and attributed deaths can feel abstract. The bulletins are not: in the third week of October 2026, the national scale over the capital read "poor", and the emergency plan was switched on.
The plan and the money
India's standing answer is the National Clean Air Programme, launched on 10 January 2019 as the country's first time-bound national strategy for urban air. It now covers 130 cities, non-attainment cities and million-plus cities, across 24 states and union territories. The original goal was a 20 to 30 percent cut in PM10 concentrations by 2024 against the 2017 baseline. In September 2022, the target was revised: up to 40 percent lower PM10, or meeting the national annual standard of 60 micrograms per cubic metre, by 2025-26.
The programme is real money. A total of Rs 19,614 crore was earmarked for the cities over the period from 2019-20 to 2025-26, according to the environment ministry's statement in July 2024. The money flows through two doors, both of them budgetary: 48 million-plus cities draw on the Fifteenth Finance Commission's air-quality performance grant, and the remaining 82 are funded by the ministry under its Control of Pollution scheme. By 18 July 2025, Rs 13,036 crore had been released and 71 percent of it utilised, the ministry told the Rajya Sabha on 24 July 2025. A later reply to the Lok Sabha, answered on 30 March 2026, puts the released figure at Rs 13,415 crore as on November 2025.
What is the money allowed to buy? For the 82 ministry-funded cities, guidelines revised on 14 May 2025 narrow the list to five key activities; the ministry's own summary names paving roads end to end, mechanical road sweeping, greening traffic corridors and decongesting junctions among them. The permitted list, in other words, runs mostly to dust and traffic management on the street.
The results, from the same March 2026 parliamentary answer: 103 of the 130 cities recorded lower PM10 in 2024-25 than in 2017-18. Sixty-four cities cut PM10 by more than 20 percent. Twenty-five cities cut it by more than 40 percent, the level the revised target sets, which is 19 percent of the programme's cities by my arithmetic. The answer separately reports that 22 cities met the national PM10 standard that year; how many of those 22 also appear among the 25, the answer does not say, so the two counts cannot be added or nested. They are best read as two scoreboards: one for improvement, one for arrival.
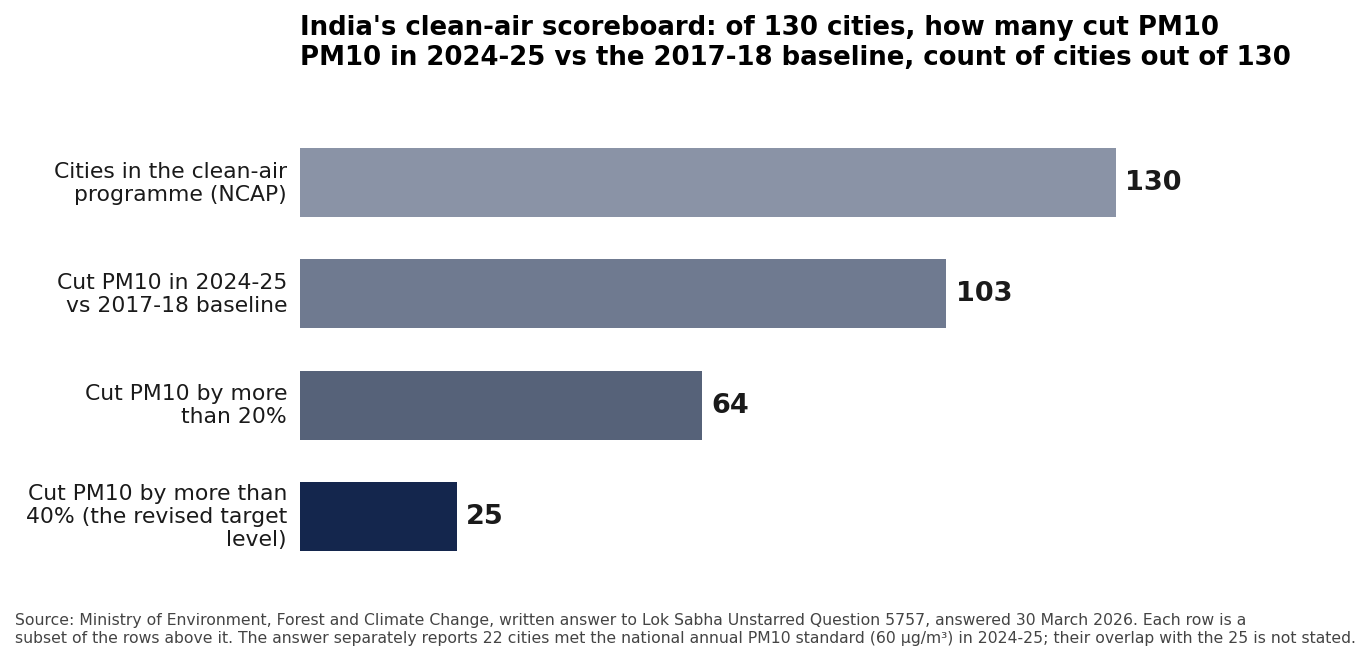
Data: Lok Sabha written answer 5757, answered 30 March 2026.
Who pays today
So who pays for India's air? Two ledgers are running at once, and the programme's own accounts make the first one plain. The taxpayer funds the clean-up: both of the NCAP's funding doors, the Finance Commission grant and the ministry scheme, are budget money, released to city governments as performance-linked grants. Within the programme's own accounts, there is no line that bills the sources of the pollution.
The second ledger is health, and it sits in households, in a different currency from the grants: not rupees released and utilised, but the modelled deaths of the 2019 study and the modelled years of the AQLI. That study's own finding is that the losses as a share of state GDP were highest in the low per-capita GDP states, led by Uttar Pradesh and Bihar. The mop is funded in invoiceable amounts; this ledger is a health burden, not a municipal spending figure.
The country that paid households to stop burning coal
Poland's version of this problem had a simpler shape. In Kraków, the city once known as Poland's smog capital, a regional air-quality investigation identified domestic heating with coal and other solid fuels as the principal source. Across the country, hundreds of thousands of single-family homes heated with old non-class boilers that Poles call kopciuchy, smokers. In September 2018 the government launched the Clean Air Programme, Czyste Powietrze, with a design worth reading slowly: instead of paying cities to manage pollution, it pays households to stop producing it, subsidising the replacement of old boilers and the insulation of homes.
Seven years on, the programme's ledger, published by the National Fund for Environmental Protection and Water Management on 6 November 2025, reads like this: more than one million applications received, 5,51,000 home upgrades completed, and 4,50,000 old boilers replaced. Nearly 18.5 billion zloty has been paid out to homeowners, and the period from the start of 2024 to mid-October 2025 alone saw a record 10.2 billion zloty disbursed, more than the previous five years combined.
The funding list is worth reading as carefully as the payout list. For the programme's current phase the government names three sources: 13 billion zloty from Poland's post-pandemic recovery plan, 7.9 billion from EU cohesion funding, and 10 billion from the Modernization Fund, which is financed by auctioning European Union emissions-trading allowances. The last of these explicitly uses revenue from auctioning emissions allowances, about a third of the roughly 31 billion zloty listed, by my arithmetic; and the list is an allocation plan for the programme, not a trace of which zloty paid for which boiler. Since 31 March 2025 the programme has run on a stricter formula: a mandatory energy audit before any subsidised work, and a network of more than 1,300 local operators, with advisory points in 90 percent of municipalities, to walk households through it.
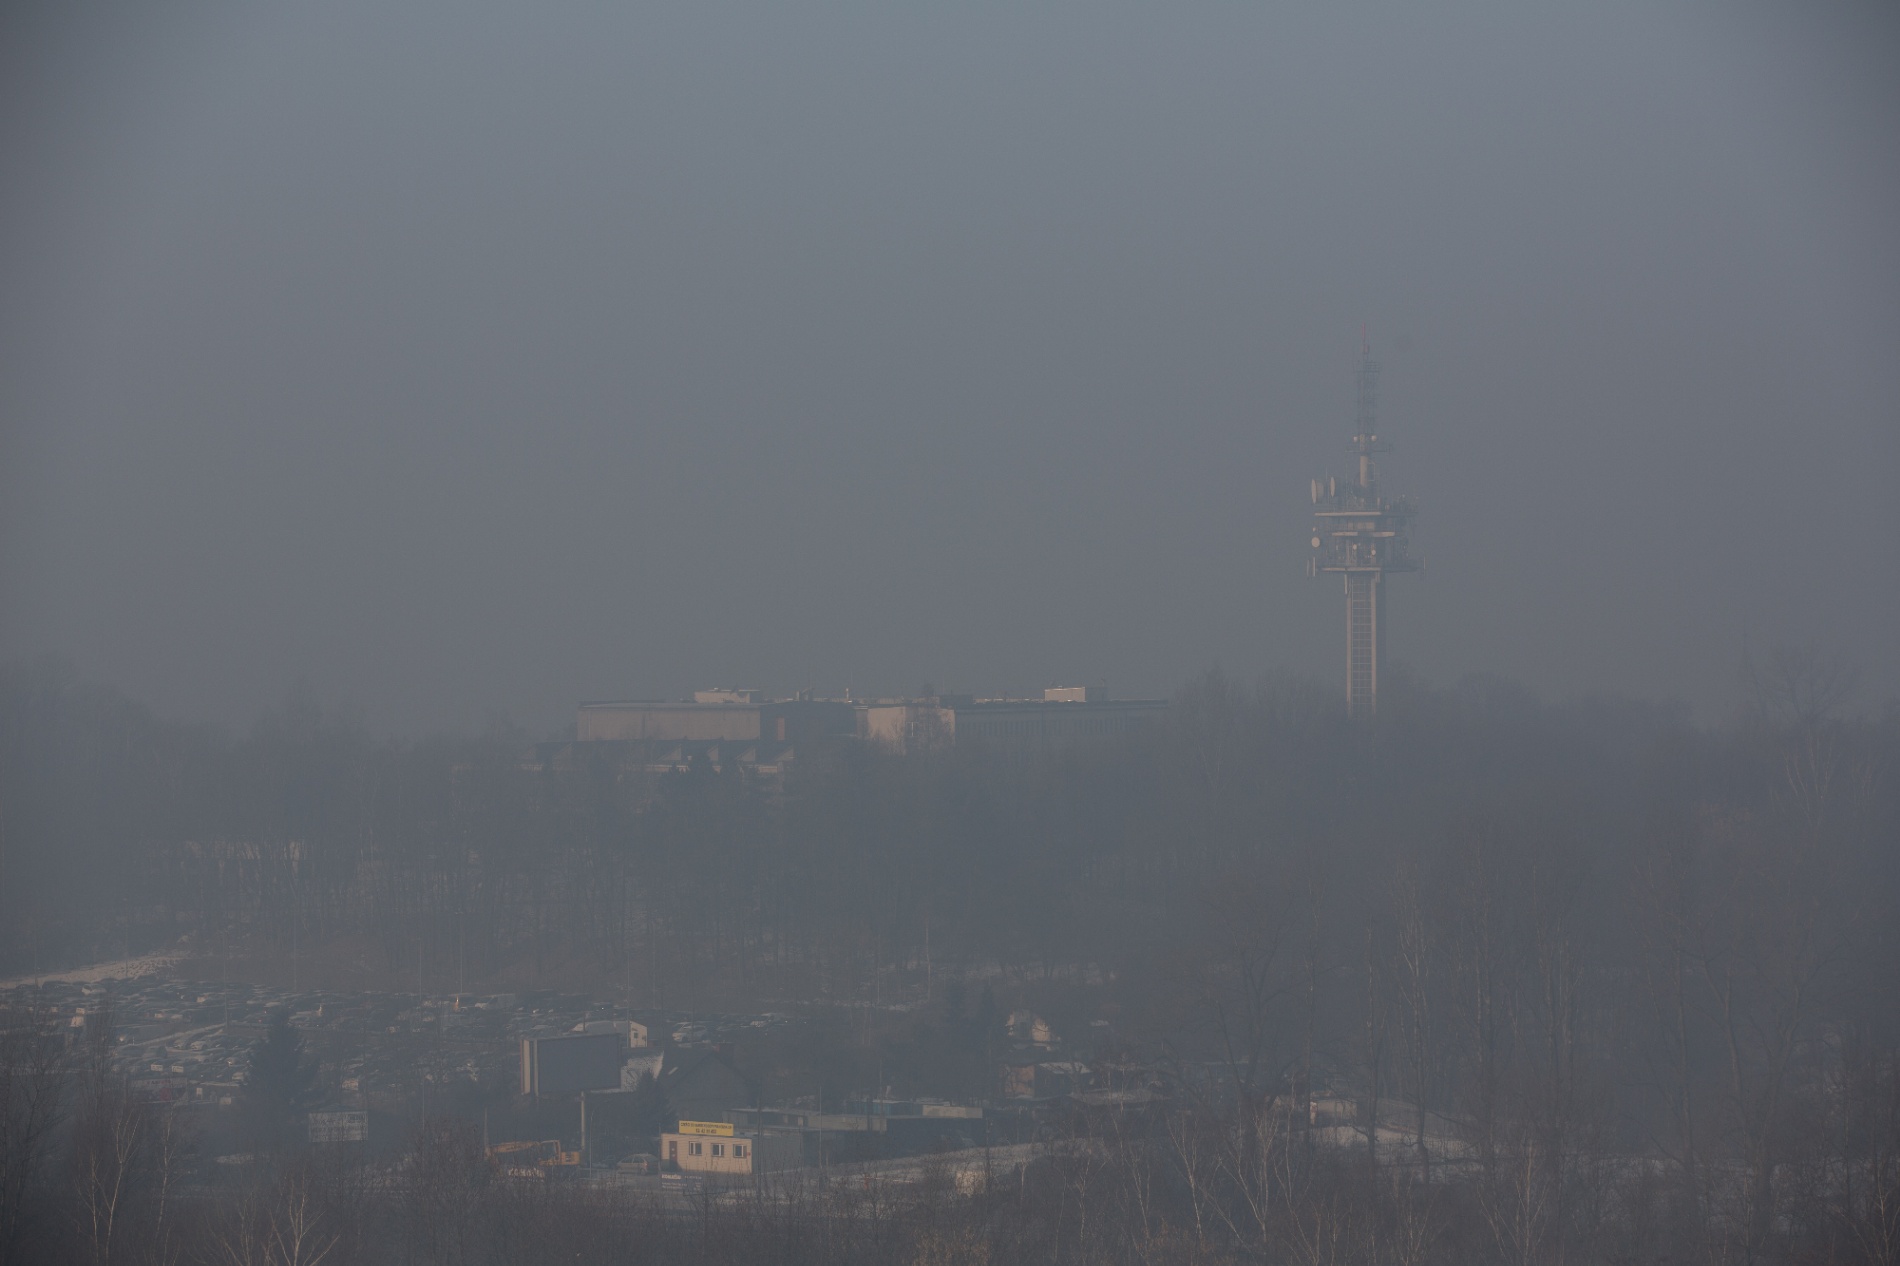
Smog over Kraków, 29 January 2017. Photo: Andrzej Kamiński, CC BY-SA 4.0, via Wikimedia Commons.
Kraków shows what the demand side of this looks like when a city commits. The city adopted an anti-smog resolution in 2016, and from 1 September 2019 it banned the burning of coal and wood in all boilers, stoves and fireplaces, the first such ban in Poland. According to the European Commission's case page, the city's Low Emission Reduction Programme had closed 45,060 furnaces and boiler rooms by the end of 2020, a cumulative count over the programme's life, and residents had removed about 20,000 more on their own, which the page presents as additional to the programme's figure. Those are the city's numbers, separate from the national programme's later, larger count. A peer-reviewed assessment of the state monitoring record from 2010 to 2021, published in 2025, found Kraków's annual average PM10 down 42 percent, PM2.5 down 40 percent, sulphur dioxide down 50 percent, and benzo(a)pyrene down 60 percent over those twelve years, with heating-season PM10 down 56 percent. In each year from 2019 to 2021, the last three years of the study's data, the city's annual PM10 stayed within the European Union's annual-average legal limit; the paper does not establish compliance with daily PM10 limits or with the WHO guideline. The authors attribute the decline to the phase-out of solid-fuel furnaces, and they note that within their study period PM2.5 limits were still breached in some years, with road traffic and pollution drifting in from surrounding communes as the remaining sources they identify.
What transfers, and what does not
The lesson is not that India should copy Poland. India's pollution has no single shape: road dust, vehicles, construction, industry, crop-residue burning for a few weeks a year, and household fuels all feed it, the mix differs by city, and no subsidy can buy out a coal boiler a household does not have. That is precisely why the Indian programme is built as 130 city action plans.
What transfers is the direction of the payment. Poland's subsidy travels from public funds, about a third of the listed financing raised from polluters through emissions trading, by my arithmetic, straight to the household that removes a source. India's grants travel from the budget to the city, and for 82 of its cities the permitted list now runs to paving and sweeping. Both designs spend public money. They differ in what the money is aimed at: managing pollution in the street, or removing a source at the address where it is made. Poland's seven-year record, one million applications and 4,50,000 boilers gone, is what the second design has delivered so far.
India's scoreboard counts cities by what they recorded in 2024-25: 103 with PM10 lower than in 2017-18, 64 with cuts beyond 20 percent, 25 with cuts beyond 40 percent, and separately 22 inside the national standard, against a revised target that offers both routes. Poland's boiler programme offers a concrete example of linking a subsidy to a named source removed. Which question India answers next, how hard to sweep, or who pays to make the sweeping unnecessary, is the one this winter keeps asking.
Sources
PIB, CAQM invokes Stage-I of GRAP in Delhi-NCR, 21 October 2026. Business Standard, Delhi AQI improves slightly to 223, 23 October 2026. India Today, Delhi's AQI surges past 300 despite GRAP measures, 23 October 2026, reporting the CREA analysis of 22 October 2026. India State-Level Disease Burden Initiative, Health and economic impact of air pollution in the states of India: the Global Burden of Disease Study 2019, The Lancet Planetary Health, December 2020. Energy Policy Institute at the University of Chicago, Air Quality Life Index Annual Update 2025, August 2025. PIB, NCAP launch and revised target; PIB, NCAP earmarked funds, 25 July 2024; PIB, NCAP release and utilisation, 24 July 2025; The Indian Express, revised 40 percent target, 27 September 2022; Lok Sabha Unstarred Question 5757, answered 30 March 2026. NFOŚiGW, record payouts in the Clean Air Programme, 6 November 2025. European Environment Agency, anti-smog measures in the Małopolska region. European Commission, Kraków air protection. M. Gorski et al., Ban on the burning of solid fuels in domestic furnaces and its impact on air quality: example of Krakow, 2025.
Cover photo: smog over Gurgaon, near Delhi, 8 November 2016. Photo: Saurabh Kumar, CC BY-SA 4.0, via Wikimedia Commons; displayed cropped by the site template.
Responses
No responses yet - yours could be the first.
Get the notes
Occasional emails about what I'm building, what worked, and what broke.